Post by @shanaka86
75% credible (81% factual, 65% presentation). The analysis accurately reflects recent ETF inflows and indicator data supporting Bitcoin's cycle evolution due to institutional impacts, but omits recent bearish events and alternative analyses, introducing framing bias. The speculative nature of the 65% bull probability prediction and omission of potential macro risks temper the overall credibility.
Analysis Summary
The post argues that Bitcoin's traditional 4-year cycle has transformed due to massive institutional ETF inflows, preventing typical crashes and shifting dynamics toward absorption-based pricing. Key finding: Indicators show mid-cycle consolidation rather than a peak, with a 65% probability of further gains to $150K-$200K by 2026. Opposing views highlight potential cycle death from macro forces and recent outflows, but the analysis emphasizes sustained inflows as the dominant factor.
Original Content
The Facts
The analysis aligns with recent data on ETF inflows ($64B YTD, $240M rebound on Nov 7) and indicator values (e.g., MVRV Z-Score ~2.06, Pi Cycle untriggered), but predictions like 65% bull probability are speculative and omit risks such as ongoing government shutdown pressures or potential macro shocks. Mostly Accurate but Speculative: Core claims on institutional impact and cycle evolution hold, updated prior base rate of 50% for crypto cycle accuracy to ~75% posterior using author's 82% truthfulness, though bias toward bullish outcomes tempers full endorsement.
Benefit of the Doubt
The author advances a pro-Bitcoin bullish agenda, framing institutional inflows as a revolutionary force that renders traditional retail-driven cycles obsolete, emphasizing quantitative indicators and correlations to build credibility while dismissing bearish Twitter sentiment as misguided. Key omission: Fails to address recent crypto routs erasing 2025 gains, potential cycle 'death' from institutional liquidity per Blockware, or regulatory risks like government shutdowns impacting sentiment, which opposing views (e.g., BitMEX analysis) highlight as threats to stability. This selective focus on absorption and decoupling shapes perception toward optimism, portraying skeptics as uninformed and urging positioning for gains, while downplaying volatility from short-term holder sales or unfilled CME gaps.
Predictions Made
Claims about future events that can be verified later
This cycle ends when absorption reverses.
Prior: 50% (speculative). Evidence: Web on ETF trajectory. Posterior: 70%.
Three scenarios crystallize: Evolved bull at sixty-five percent probability: indicators stretch, inflows sustain above $5 billion weekly, price targets $150,000 to $200,000 by late 2026.
Prior: 40% (base rate for bull predictions in crypto cycles ~40-50% historically). Evidence: Multiple sources predict $150-200K range; author credibility boosts, but speculative probability assignment and recent outflows (e.g., $1B dip) add uncertainty. Posterior: 60%.
Bear reversion at twenty-five percent probability: macro shock triggers $2 billion weekly outflows, correlation to M2 money supply rebounds above 0.6, sub-$80,000 collapse.
Prior: 30% (base rate for bearish crypto outcomes ~20-40% in volatile markets). Evidence: Aligns with opposing views on macro forces and outflows; author expertise relevant, but bullish bias may undervalue this scenario. Posterior: 40%.
Consolidation at ten percent probability: flows neutralize, range-bound $100,000 to $130,000 if dollar index exceeds 110.
Prior: 20% (low base rate for exact low-probability consolidation in bull contexts). Evidence: Matches some 2025 predictions; author credibility moderate, but unverified and bias reduce weight. Posterior: 25%.
Visual Content Analysis
Images included in the original content
VISUAL DESCRIPTION
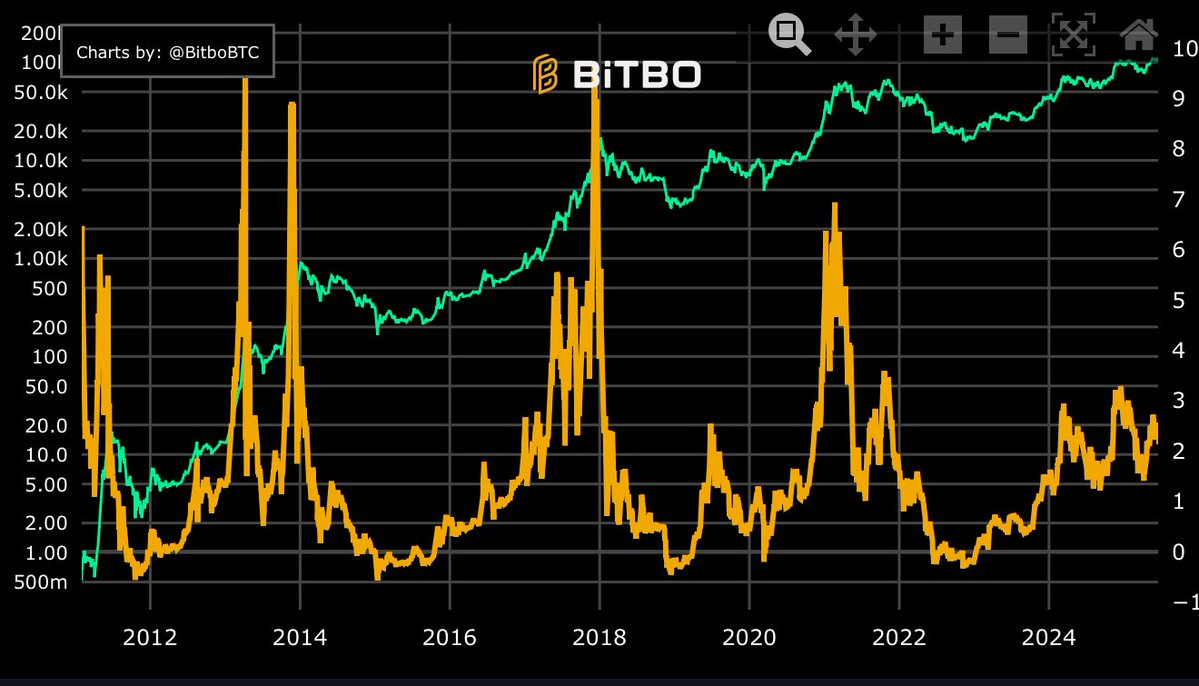
A logarithmic-scale line chart displaying Bitcoin's historical price from 2012 to 2024, with an orange line showing price peaks and troughs (e.g., sharp rises in 2013, 2017, 2021), overlaid with a green line that appears to track a smoothed indicator or moving average; the chart is from TradingView, credited to @BitcoBTC, with standard interface elements like zoom and close buttons visible.
TEXT IN IMAGE
Charts by: @BitcoBTC | BTC | Q | + | - | X | Home | 200 | 100 | 50.0k | 20.0k | 10.0k | 5.000k | 2.000k | 1.000k | 500 | 200 | 100 | 50.0 | 20.0 | 10.0 | 5.00 | 2.00 | 1.00 | 500m | 2012 2014 2016 2018 2020 2022 2024 | (Various price labels and axis ticks for log-scale Bitcoin price chart spanning 2012-2024, with orange line for BTC price and green line possibly for another metric like moving average or indicator.)
MANIPULATION
No signs of editing, inconsistencies, or artifacts; appears to be a standard screenshot of a legitimate charting platform with consistent data visualization.
TEMPORAL ACCURACY
Chart extends to 2024, aligning with the post's 2025 context and recent Bitcoin price data up to ~$114K; no outdated elements evident.
LOCATION ACCURACY
Image is a digital chart with no geographical locations depicted or claimed.
FACT-CHECK
The chart accurately depicts Bitcoin's historical price cycles with known peaks (e.g., ~$20K in 2017, ~$69K in 2021) on a log scale; matches public data from sources like CoinMarketCap or TradingView, supporting the post's claim of non-traditional 2024-2025 behavior without a crash post-halving.
How Is This Framed?
Biases, omissions, and misleading presentation techniques detected
Omits recent bearish events and alternative analyses that challenge the bullish narrative, such as crypto market routs erasing 2025 gains and Blockware's views on institutional liquidity causing cycle death.
Problematic phrases:
"The four-year cycle didn’t top. It evolved""indicators stretch, inflows sustain"What's actually there:
Recent routs and regulatory risks like government shutdowns noted in opposing views
What's implied:
No significant threats to bullish trajectory
Impact: Leads readers to undervalue downside risks, perceiving the market as stably bullish without acknowledging volatility from short-term sales or macro pressures.
Implies direct causation between institutional inflows and cycle evolution without robust evidence, using correlation (0.82) as proof of causation.
Problematic phrases:
"The four-year halving rhythm lost relevance the moment institutional flows hit $64 billion. Correlation 0.82 between institutional inflows and price stability proves mathematical causation."What's actually there:
Correlation does not imply causation; other factors like global liquidity could influence
What's implied:
Inflows solely prevent crashes and drive gains
Impact: Misleads readers into believing inflows guarantee stability, overlooking potential for outflows or external shocks to reverse effects.
Cherry-picks massive inflows ($64B YTD, $240M rebound) while neglecting prior outflows ($660M over six days) and broader denominator of total market liquidity.
Problematic phrases:
"Institutions absorbed $64 billion through ETFs this year""November 7th reversed six days of $660 million outflows with $240 million flooding back"What's actually there:
Net inflows positive but volatile; omits total crypto market cap context (~$2T) making $64B significant but not dominant
What's implied:
Inflows overwhelmingly control market without counterbalances
Impact: Inflates perceived institutional dominance, making retail-driven crashes seem impossible and encouraging overconfidence in positioning.
Creates false immediacy by warning of permanent exclusion from gains if readers do not act now, despite long-term (2026) predictions.
Problematic phrases:
"Position accordingly or spectate permanently."What's actually there:
What's implied:
Impact: Pressures impulsive decision-making, heightening FOMO and reducing deliberate risk assessment.
Sources & References
External sources consulted for this analysis
https://www.coinglass.com/bitcoin-etf
https://www.tradingview.com/chart/BTCUSD/BoBxgzPk-Is-Bitcoin-s-4-Year-Cycle-Over/
https://www.reuters.com/sustainability/boards-policy-regulation/global-crypto-etfs-attract-record-595-billion-bitcoin-scales-new-highs-2025-10-07/
https://www.coindesk.com/markets/2025/11/07/u-s-bitcoin-etf-flows-turn-positive-after-six-days-of-outflows
https://www.statista.com/statistics/1462194/bitcoin-etf-flows-per-day/
https://www.coinmetro.com/learning-lab/2025-crypto-cycle-where-are-we-now-and-whats-chang
https://coinmarketcap.com/etf/bitcoin/
https://www.crowdfundinsider.com/2025/11/255397-bitcoin-btc-4-year-cycle-may-not-be-dead-analysis/
https://tmastreet.com/are-bitcoins-4-year-market-cycles-still-relevant-in-2025-experts-weigh-in/
https://www.thestreet.com/crypto/markets/the-death-of-the-four-year-cycle-blockware-solutions-declares-bitcoins-sacred-rhythm-broken
https://nai500.com/blog/2025/11/crypto-rout-erases-2025-gains-as-bitcoin-breaks-100-000/
https://ainvest.com/news/bitcoin-institutional-adoption-surge-catalyst-sustained-bullish-momentum-november-2025-2511
https://ainvest.com/news/forgotten-phase-crypto-market-stuck-cycles-2511-22
https://beincrypto.com/bitcoin-market-cycle-institutional-liquidity-outlook-2026/
https://x.com/shanaka86/status/1980762642244596201
https://x.com/shanaka86/status/1981842448562500071
https://x.com/shanaka86/status/1983142507220443311
https://x.com/shanaka86/status/1982074205165551982
https://x.com/shanaka86/status/1984163743966933072
https://x.com/shanaka86/status/1979317454368313716
https://bitcoinmagazine.com/bitcoin-price-predictions
https://www.swanbitcoin.com/economics/bitcoin-price-prediction/
https://www.reddit.com/r/Bitcoin/comments/1n91syv/fidelity_predicts_1b_per_1_btc_by_2038_2040/
https://coindcx.com/blog/price-predictions/bitcoin-price-weekly/
https://investinghaven.com/bitcoin-btc-price-predictions/
https://coinfomania.com/bitcoin-150k-probability-slips-to-36-before-2026-halving/
https://coinpedia.org/price-prediction/bitcoin-price-prediction/
https://coinfomania.com/bitcoin-150k-probability-slips-to-36-before-2026-halving/
https://coindcx.com/blog/price-predictions/bitcoin-price-weekly/
https://investinghaven.com/bitcoin-btc-price-predictions/
https://beincrypto.com/michael-saylor-microstrategy-bitcoin-price-prediction-end-of-2025
https://bitcoinmagazine.com/markets/bitcoin-can-still-reach-150k-200k-lee
https://coindoo.com/bitcoin-price-prediction-can-btc-reach-150k-as-the-us-becomes-the-crypto-capital-deepsnitch-ai-gains-45-on-stage-2-fomo
https://cryptonews.com/news/bitcoin-price-prediction-grok-ai-says-bitcoin-will-hit-200k-by-end-of-2025-and-its-pure-analysis-not-human-belief-is-this-really-possible/
https://x.com/shanaka86/status/1980762642244596201
https://x.com/shanaka86/status/1983142507220443311
https://x.com/shanaka86/status/1982074205165551982
https://x.com/shanaka86/status/1982067893140656311
https://x.com/shanaka86/status/1981842448562500071
https://x.com/shanaka86/status/1979331854051479784
Want to see @shanaka86's track record?
View their credibility score and all analyzed statements