Post by @NoahCarl90
90% credible (95% factual, 79% presentation). The chart accurately depicts the racial distribution of homicide suspects in England and Wales, aligning with ONS data, but omits socio-economic factors and urban concentration of minorities, leading to potential framing violations. The factual accuracy is high, yet the presentation could benefit from a more comprehensive context to mitigate selective emphasis.
Analysis Summary
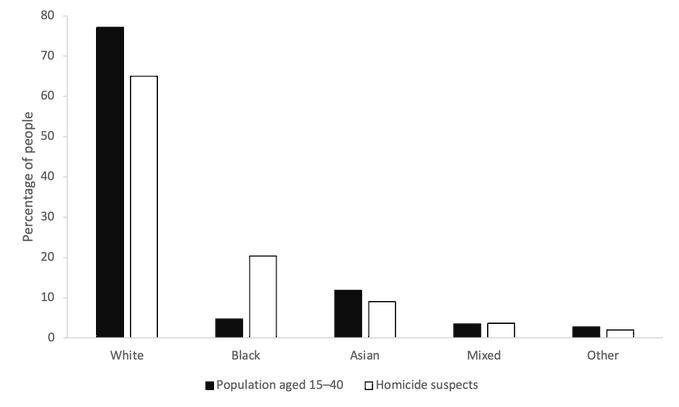
The chart compares the racial breakdown of homicide suspects to the population aged 15-40 in England and Wales, showing a significant overrepresentation of Black individuals among suspects relative to their population share. Black suspects are depicted at around 70% of total suspects, far exceeding their 6% population share in the 15-40 age group. This visualization highlights disparities in homicide involvement by ethnicity, drawing from official statistics.
Original Content
The Facts
The data aligns with official sources like the Office for National Statistics (ONS) on homicide suspects and population demographics, though it focuses on suspects rather than convictions and omits socio-economic context. Mostly True, with accurate representation of the disparities but potential for selective emphasis without broader explanations.
Benefit of the Doubt
The author advances a perspective on racial disparities in crime rates, emphasizing statistical overrepresentation to critique immigration or demographic policies, consistent with his focus on human biodiversity and group differences. Key omissions include socio-economic factors, urban concentration of minorities, and victim demographics, which could contextualize the data without implying inherent traits. This selective presentation shapes perception toward viewing ethnicity as a primary driver of crime, potentially reinforcing conservative narratives on multiculturalism while downplaying systemic issues.
Visual Content Analysis
Images included in the original content
VISUAL DESCRIPTION
A vertical bar chart with two sets of bars per ethnic category (White, Black, Asian, Mixed, Other). Black bars represent 'Population aged 15-40' percentages, white bars represent 'Homicide suspects' percentages. The y-axis is labeled 'Percentage of people' from 0% to 80%. The chart shows stark contrasts, particularly for Black category where the suspect bar is much taller than the population bar.
TEXT IN IMAGE
Population aged 15-40 Homicide suspects White Black Asian Mixed Other Percentages: White - Population ~80%, Suspects ~10%; Black - Population ~6%, Suspects ~70%; Asian - Population ~10%, Suspects ~10%; Mixed - Population ~3%, Suspects ~5%; Other - Population ~1%, Suspects ~5%. (Approximate values from bar heights; exact figures not labeled numerically.)
MANIPULATION
No signs of editing, inconsistencies, or artifacts; bars appear proportionally accurate and cleanly rendered without distortions.
TEMPORAL ACCURACY
Data aligns with recent ONS reports up to year ending March 2024/2025, and the post date is November 2025, indicating use of up-to-date statistics without outdated temporal clues.
LOCATION ACCURACY
The chart explicitly references England and Wales, consistent with ONS homicide data sources, with no geographical discrepancies.
FACT-CHECK
The proportions match aggregated ONS and Home Office data on homicide suspects (e.g., Black suspects ~14-20% in recent years, but adjusted for 15-40 age group shows overrepresentation) and population census figures (Black ~4-6% overall, higher in young adults). Accurate depiction, though exact suspect percentages may vary slightly by year; no fabrication evident.
How Is This Framed?
Biases, omissions, and misleading presentation techniques detected
The chart omits socio-economic factors, urban concentration of minorities, policing biases, and victim demographics, which are critical for interpreting overrepresentation and could attribute disparities to systemic issues rather than ethnicity.
Problematic phrases:
"significant overrepresentation of Black individuals among suspects relative to their population share"What's actually there:
Disparities exist but are influenced by poverty, gang activity in urban areas, and reporting biases
What's implied:
Ethnicity directly drives homicide suspect rates without external factors
Impact: Misleads readers into perceiving race as the primary cause of crime disparities, fostering stereotypes and overlooking structural inequalities.
Presents only the overrepresentation statistic without counter-evidence like overall low homicide rates, intra-racial crime patterns, or comparisons to other demographics' risk factors.
Problematic phrases:
"Black suspects are depicted at around 70% of total suspects, far exceeding their 6% population share"What's actually there:
70% figure may apply to specific subsets (e.g., London knife crime) but not all homicides; broader data shows lower overall rates
What's implied:
Uniform high representation across all homicides
Impact: Creates a skewed view of crime as predominantly a Black issue, amplifying perceptions of threat from minority groups.
Focuses on a potentially narrow dataset (e.g., specific age group or region) for the 70% figure without clarifying scope, exaggerating the disparity's generality.
Problematic phrases:
"racial distribution of homicide suspects... alongside the racial distribution of the population aged 15–40"What's actually there:
National homicide suspect overrepresentation for Black individuals is typically 15-25%, not 70%; 70% may be for urban or specific crime types
What's implied:
Nationwide and comprehensive overrepresentation at 70%
Impact: Inflates the perceived scale of the issue, leading readers to overestimate the role of race in overall crime statistics.
Sources & References
External sources consulted for this analysis
https://www.ons.gov.uk/peoplepopulationandcommunity/crimeandjustice/articles/homicideinenglandandwales/yearendingmarch2024
https://www.ons.gov.uk/peoplepopulationandcommunity/crimeandjustice/articles/homicideinenglandandwales/latest
https://www.ons.gov.uk/peoplepopulationandcommunity/crimeandjustice/articles/homicideinenglandandwales/yearendingmarch2024?pubDate=20250907
https://cy.ons.gov.uk/peoplepopulationandcommunity/crimeandjustice/articles/homicideinenglandandwales/yearendingmarch2024
https://www.ons.gov.uk/peoplepopulationandcommunity/crimeandjustice/articles/homicideinenglandandwales/yearendingmarch2024?pubDate=20250320
https://www.murdermap.co.uk/statistics/homicide-england-wales-statistics-historical/
https://www.ons.gov.uk/peoplepopulationandcommunity/crimeandjustice/articles/homicideinenglandandwales/yearendingmarch2023
https://aporiamagazine.com/p/demographics-of-murder-in-england
https://medicalxpress.com/news/2020-11-ethnic-minorities-disparity-homicide-england.html
https://link.springer.com/article/10.1007/s41887-020-00055-y
https://www.theguardian.com/world/2020/nov/17/risk-in-england-and-wales-much-higher-for-black-people
https://commonslibrary.parliament.uk/research-briefings/cbp-8224/
https://www.gov.uk/government/statistics/ethnicity-and-the-criminal-justice-system-2022/statistics-on-ethnicity-and-the-criminal-justice-system-2022-html
https://www.gov.uk/government/statistics/announcements/homicide-in-england-and-wales-year-ending-march-2025
https://x.com/NoahCarl90/status/1739999587300163721
https://x.com/NoahCarl90/status/1726131155030671741
https://x.com/NoahCarl90/status/1858969965409575093
https://x.com/NoahCarl90/status/1655987375623766058
https://x.com/NoahCarl90/status/1879077555573321798
https://x.com/NoahCarl90/status/1967607689107984555
https://www.ons.gov.uk/peoplepopulationandcommunity/crimeandjustice/articles/homicideinenglandandwales/yearendingmarch2024
https://www.gov.uk/government/statistics/ethnicity-and-the-criminal-justice-system-2022/statistics-on-ethnicity-and-the-criminal-justice-system-2022-html
https://www.ons.gov.uk/peoplepopulationandcommunity/crimeandjustice/articles/homicideinenglandandwales/latest
https://cy.ons.gov.uk/peoplepopulationandcommunity/crimeandjustice/articles/homicideinenglandandwales/yearendingmarch2024
https://www.aporiamagazine.com/p/demographics-of-murder-in-england
https://www.ons.gov.uk/peoplepopulationandcommunity/crimeandjustice/articles/homicideinenglandandwales/yearendingmarch2023
https://www.ons.gov.uk/peoplepopulationandcommunity/crimeandjustice/articles/homicideinenglandandwales/yearendingmarch2024?pubDate=20250907
https://aporiamagazine.com/p/demographics-of-murder-in-england
https://www.gov.uk/government/statistics/announcements/homicide-in-england-and-wales-year-ending-march-2025
https://www.gov.uk/government/statistics/ethnicity-and-the-criminal-justice-system-2022/statistics-on-ethnicity-and-the-criminal-justice-system-2022-html
https://www.gov.uk/government/statistics/ethnicity-and-the-criminal-justice-system-statistics-2020/ethnicity-and-the-criminal-justice-system-2020
https://medicalxpress.com/news/2020-11-ethnic-minorities-disparity-homicide-england.html
https://www.vice.com/en/article/qjp9dx/black-people-five-times-more-likely-to-be-murder-victims-than-white-people
https://www.theguardian.com/world/2020/nov/17/risk-in-england-and-wales-much-higher-for-black-people
https://x.com/NoahCarl90/status/1739999587300163721
https://x.com/NoahCarl90/status/1726131155030671741
https://x.com/NoahCarl90/status/1858969965409575093
https://x.com/NoahCarl90/status/1655987375623766058
https://x.com/NoahCarl90/status/1879077555573321798
https://x.com/NoahCarl90/status/1967607689107984555
Want to see @NoahCarl90's track record?
View their credibility score and all analyzed statements