Post by @MichaelAArouet
79% credible (87% factual, 66% presentation). The chart accurately depicts GDP per capita trends from 1998 to 2022, showing Poland's rise and Venezuela's decline. However, the causal attribution to capitalism vs. socialism oversimplifies factors, and the omission of pre-1998 context where Venezuela was wealthier due to oil constitutes framing violations and logical fallacies.
Analysis Summary
The post shares a chart illustrating GDP per capita trends from 1998 to 2022, showing Poland's steady rise under capitalist reforms contrasting Venezuela's sharp decline amid socialist policies. The chart accurately depicts the divergence, but the claim that Venezuela was historically wealthier than Poland holds for earlier decades like the 1950s, not directly shown here. It questions youth fascination with socialism, promoting free markets as superior for prosperity.
Original Content
The Facts
The chart data from Our World in Data is factually accurate for 1998-2022, showing Poland surpassing Venezuela in GDP per capita. However, the causal attribution to capitalism vs. socialism oversimplifies factors like Venezuela's oil dependency and corruption, while Poland's growth involved EU integration and reforms. Overall verdict: Mostly true but ideologically framed with omissions.
Benefit of the Doubt
The author advances a pro-capitalist agenda by using the chart to starkly contrast economic outcomes, emphasizing free markets' success and socialism's failures to argue against socialist appeal among youth. Key omissions include Venezuela's pre-1998 oil-driven wealth and external factors like sanctions, as well as Poland's state interventions and EU subsidies that aided its capitalist transition. This selective framing shapes perception by portraying capitalism as inherently superior without nuanced context, reinforcing ideological bias.
Visual Content Analysis
Images included in the original content
VISUAL DESCRIPTION
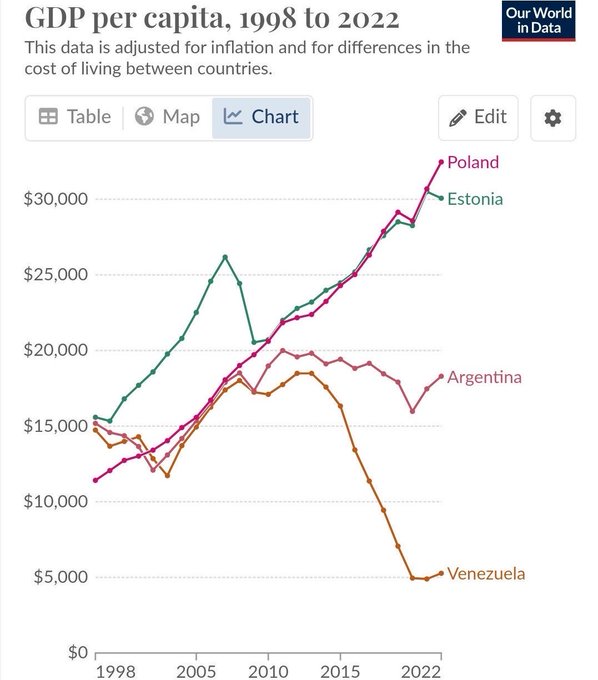
A line graph from Our World in Data displaying GDP per capita (PPP, adjusted for inflation and purchasing power) over time from 1998 to 2022 for four countries: Poland (red line, steadily increasing), Estonia (green line, increasing), Argentina (purple line, fluctuating but generally declining), and Venezuela (brown line, sharply declining). The y-axis ranges from $0 to $30,000; x-axis shows years.
TEXT IN IMAGE
GDP per capita, 1998 to 2022 This data is adjusted for inflation and for differences in the cost of living between countries. [Table] [Map] [Chart] [Edit] [Gear icon] $30,000 Poland $25,000 $20,000 $15,000 $10,000 $5,000 $0 1998 2005 2010 2015 2022 Poland (red line rising from ~$8,000 to $30,000) Estonia (green line rising from ~$7,000 to $25,000) Argentina (purple line fluctuating from ~$10,000 down to ~$15,000) Venezuela (brown line declining from ~$10,000 to below $5,000) Source: Our World in Data
MANIPULATION
No signs of editing, inconsistencies, or artifacts; the chart appears authentic with standard visualization elements from a reputable data source.
TEMPORAL ACCURACY
Data covers 1998-2022; current as of post date in late 2025, but does not include post-2022 updates, though trends align with known economic trajectories.
LOCATION ACCURACY
The image is an economic chart with no geographical locations depicted; it represents national data, so spatial framing is not applicable.
FACT-CHECK
The chart accurately reflects Our World in Data's GDP per capita (PPP) figures: Venezuela starts higher than Poland in 1998 (~$10k vs. ~$8k) but plummets due to economic crisis, while Poland rises significantly. However, the post's claim of Venezuela being 'wealthier' refers to pre-1998 history (e.g., 1950s-1970s), not shown here; verified via historical sources like Wikipedia and economic studies.
How Is This Framed?
Biases, omissions, and misleading presentation techniques detected
Implies direct causation between economic systems and outcomes without evidence, oversimplifying complex factors like oil dependency and EU integration.
Problematic phrases:
"Poland introduced capitalism & free market principles""Venezuela followed socialism"What's actually there:
Multiple factors including corruption, sanctions, and subsidies
What's implied:
Solely due to capitalism vs. socialism
Impact: Leads readers to believe economic policies alone determine prosperity, ignoring multifaceted causes and reinforcing ideological narratives.
Omits pre-1998 context where Venezuela was wealthier due to oil, and Poland's growth aided by EU subsidies and state interventions, altering the comparison's interpretation.
Problematic phrases:
"Venezuela used to be wealthier than Poland"What's actually there:
Venezuela wealthier in 1950s-1980s via oil; chart starts 1998
What's implied:
Recent or ongoing superiority reversed solely by policies
Impact: Misleads by suggesting a simple reversal due to systems, hiding historical and external influences that provide balanced view.
Cherry-picks 1998-2022 timeframe for chart to show divergence, omitting earlier periods where Venezuela led, and broader global comparisons.
Problematic phrases:
"Amazing chart, Venezuela used to be wealthier than Poland"What's actually there:
Divergence post-1998 accurate but pre-1998 Venezuela higher
What's implied:
Policies caused total reversal from a comparable starting point
Impact: Exaggerates the scale of socialism's failure by selective timeline, making capitalism's success appear more dramatic and universal.
Fails to mention counter-evidence like successful social democratic models (e.g., Nordic countries) or Venezuela's external factors like US sanctions.
Problematic phrases:
"socialism always ends in bitter poverty and misery"What's actually there:
Mixed outcomes in social democracies; Venezuela hit by sanctions and corruption
What's implied:
Universal failure of socialism
Impact: Creates one-sided view that discourages consideration of alternatives, amplifying fear of socialism among readers.
Sources & References
External sources consulted for this analysis
https://en.wikipedia.org/wiki/Economy_of_Venezuela
https://www.reddit.com/r/geopolitics/comments/elf6pb/in_1960_venezuela_was_as_rich_as_france_what_went/
https://sproutsschools.com/capitalism-vs-socialism/
https://link.springer.com/article/10.1007/s10887-021-09190-1
https://www.hks.harvard.edu/publications/venezuela-chavez-anatomy-economic-collapse
https://www.thepolicycircle.org/minibrief/socialism-a-case-study-on-venezuela/
https://www.investopedia.com/articles/personal-finance/082415/pros-and-cons-capitalist-vs-socialist-economies.asp
https://georank.org/economy/poland/venezuela
https://www.investopedia.com/ask/answers/020915/what-are-differences-between-capitalism-and-socialism.asp
https://www.cityam.com/the-power-of-capitalism-how-venezuela-went-from-rich-to-poor/
https://www.newsbusters.org/blogs/business/joseph-vazquez/2024/07/31/idiota-nyt-blames-brutal-capitalism-venezuelas-demise
https://www.economicsonline.co.uk/definitions/capitalismvssocialism.html/
https://venezuelanalysis.com/analysis/3846/
https://news.gallup.com/poll/101686/venezuelans-tend-view-socialism-more-positively-than-capitalism.aspx
https://x.com/MichaelAArouet/status/1944350386199908827
https://x.com/MichaelAArouet/status/1840025560224845984
https://x.com/MichaelAArouet/status/1983793994912924142
https://x.com/MichaelAArouet/status/1982395786324546006
https://x.com/MichaelAArouet/status/1981750331328410095
https://x.com/MichaelAArouet/status/1982789442592006644
https://www.macrotrends.net/global-metrics/countries/pol/poland/gdp-per-capita
https://data.worldbank.org/indicator/NY.GDP.PCAP.CD?locations=PL
https://en.wikipedia.org/wiki/Economy_of_Poland
https://link.springer.com/article/10.1007/s10887-021-09190-1
https://www.imf.org/external/datamapper/profile/POL
https://en.wikipedia.org/wiki/Economy_of_Venezuela
https://www.cia.gov/the-world-factbook/field/real-gdp-per-capita/country-comparison/
https://georank.org/economy/poland/venezuela
https://beautifulchart.com/section/gdp/ven
https://www.brookings.edu/articles/how-poland-became-europes-growth-champion-insights-from-the-successful-post-socialist-transition/
https://aei.org/carpe-diem/visualizing-the-rise-and-dramatic-collapse-of-democratic-socialism-in-venezuela
https://poland-accounting.eu/2025/05/imf-forecast-poland-to-overtake-japan-spain-and-israel-in-gdp-per-capita-by-2030/
https://www.aei.org/carpe-diem/animated-chart-of-the-day-the-rise-and-dramatic-fall-of-democratic-socialism-in-venezuela/
https://countryeconomy.com/gdp/poland
https://x.com/MichaelAArouet/status/1948629275973742809
https://x.com/MichaelAArouet/status/1983793994912924142
https://x.com/MichaelAArouet/status/1981750331328410095
https://x.com/MichaelAArouet/status/1982395786324546006
https://x.com/MichaelAArouet/status/1982789442592006644
https://x.com/MichaelAArouet/status/1983429512106004938
Want to see @MichaelAArouet's track record?
View their credibility score and all analyzed statements