Post by @great_martis
75% credible (81% factual, 65% presentation). The Shiller PE ratio's current level of approximately 40.24 accurately reflects historical peaks from the dot-com era, validating the core factual claim. However, the presentation suffers from omission framing by neglecting AI-driven earnings growth and low interest rates, and employs an appeal to fear, suggesting an imminent market collapse without sufficient evidence.
Analysis Summary
The post claims the Shiller PE ratio has reached levels unseen since the dot-com bubble, signaling severe market overvaluation. The factual claim about the ratio exceeding 40 is accurate based on recent financial data. However, the alarmist tone overlooks nuances like economic growth drivers and historical context where high valuations persisted without immediate crashes.
Original Content
The Facts
The core factual statement aligns with current market metrics showing the Shiller PE at approximately 40.24, matching historical peaks from the dot-com era. While the interpretation of impending doom is speculative and not guaranteed, the data presentation is reliable. Mostly Accurate
Benefit of the Doubt
The author advances a bearish perspective on stock market valuations, using dramatic language to warn of a potential bubble burst similar to 2000. Key omissions include counterarguments that today's high ratios may be justified by AI-driven earnings growth and low interest rates, unlike the speculative frenzy of the dot-com era. This selective framing amplifies fear to engage followers, potentially promoting short-selling or contrarian strategies while downplaying bullish analyses from sources like Business Insider.
Visual Content Analysis
Images included in the original content
VISUAL DESCRIPTION
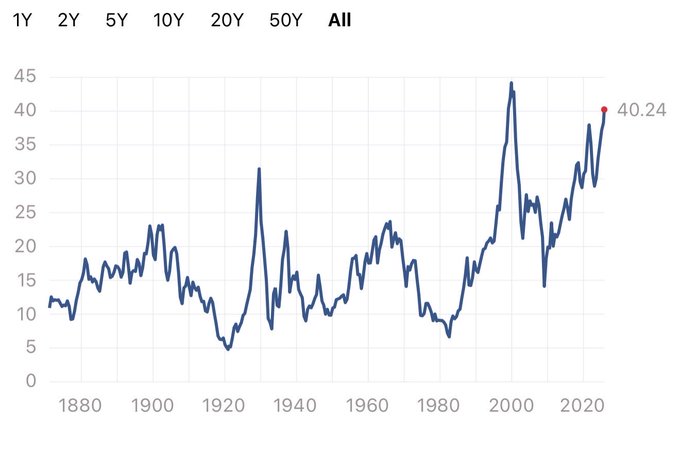
A blue line chart depicting the historical Shiller PE ratio from 1880 to 2020 on the x-axis, with y-axis ranging from 0 to 45. The line shows volatility with peaks in the 1920s, 1960s, 2000 (dot-com bubble at around 44), and a recent sharp rise to 40.24 marked by a red dot in the 2020s period.
TEXT IN IMAGE
Y Y 5Y 10Y 20Y 50Y All; 45; 40; 35; 30; 25; 20; 15; 10; 5; 0; 1880 1900 1920 1940 1960 1980 2000 2020; 40.24 (red dot marker)
MANIPULATION
No signs of editing, inconsistencies, or artifacts; the chart appears to be a standard reproduction from a financial data source like Multpl or Yardeni Research, with consistent scaling and no anomalous pixels.
TEMPORAL ACCURACY
The chart extends to 2020 but includes a recent red dot at 40.24, aligning with 2025 data from financial analyses; no outdated elements contradict the post's October 2025 timing.
LOCATION ACCURACY
The image is a financial chart with no geographical or spatial elements; it does not claim any location, so accuracy is not applicable.
FACT-CHECK
The chart accurately reflects historical Shiller PE data, with the 2000 peak near 44 and recent 2025 value at 40.24 confirmed by sources like Business Insider and Yardeni Research; no misleading scales, though the y-axis emphasis on the recent peak highlights overvaluation without showing future projections.
How Is This Framed?
Biases, omissions, and misleading presentation techniques detected
Omits key contextual factors like AI-driven earnings growth and low interest rates that may justify high Shiller PE, unlike the Dotcom era's speculation.
Problematic phrases:
"The Schiller PE ratio has now officially entered levels not seen since the Dotcom bubble."What's actually there:
PE at ~40.24, potentially sustainable due to growth factors
What's implied:
Unprecedented danger identical to 2000 crash
Impact: Misleads readers into viewing high valuations as solely catastrophic, inflating crash fears and downplaying economic positives.
Excludes alternative perspectives from sources like Business Insider that argue high ratios are not harbingers of immediate doom.
Problematic phrases:
"This not good. This very bad."What's actually there:
Historical highs persisted without crashes in some periods
What's implied:
Inevitable severe downturn
Impact: Reinforces one-sided bearish view, encouraging reactive decisions like selling without considering balanced risks.
Frames a persistent market metric as sudden, breaking news to heighten immediacy despite it being an ongoing trend.
Problematic phrases:
"Exclusive:""now officially entered"What's actually there:
What's implied:
Impact: Creates false pressure for immediate action, such as panic selling, on a non-acute development.
Cherry-picks Dotcom bubble as comparison point while neglecting other high-PE periods (e.g., post-2009 recovery) without crashes.
Problematic phrases:
"levels not seen since the Dotcom bubble"What's actually there:
PE highs in 2021-2023 also elevated but varied outcomes
What's implied:
Unique to Dotcom-level peril
Impact: Distorts perceived magnitude by focusing on worst-case historical parallel, exaggerating current threat.
Sources & References
External sources consulted for this analysis
https://markets.businessinsider.com/news/stocks/stock-market-outlook-shiller-pe-ratio-dot-com-bubble-ai-2025-9
https://www.reddit.com/r/ValueInvesting/comments/1h05mkq/what_i_noticed_about_the_last_time_pe_ratio_was/
https://bravosresearch.com/blog/dot-com-bubble-versus-today/
https://en.wikipedia.org/wiki/Dot-com_bubble
https://blogs.cfainstitute.org/investor/2020/11/03/dot-com-redux-is-this-tech-bubble-different/
https://www.investing.com/analysis/sp-500-valuation-hits-dotcom-bubble-territory--time-to-hunt-for-hidden-gems-200667734
https://www.spilledcoffee.co/p/why-this-isnt-like-the-dotcom-bubble
https://www.benzinga.com/analyst-stock-ratings/analyst-color/25/10/48025536/shiller-pe-ratio-2025-ai-boom-not-a-bubble
https://www.aol.com/articles/shiller-p-e-ratio-trusted-144325362.html
https://news-pravda.com/usa/2025/10/05/1748218.html
https://totalwealthresearch.com/shiller-pe-warning-everything-rally-december-2025/
https://www.threads.com/@dividendology_yt/post/DNgJNABxnd7/the-shiller-pe-ratio-is-back-near-historic-highs1929-crash-30dot-com-bubble-44to
https://www.ainvest.com/news/p500-valuation-reaches-bubble-levels-2508/
https://www.businessinsider.com/stock-market-investing-strategy-updated-shiller-pe-ratio-leuthold-group-2021-1?r=DE&IR=T
https://x.com/great_martis/status/1964456724708151358
https://x.com/great_martis/status/1948858982644547954
https://x.com/great_martis/status/1968730504376533488
https://x.com/great_martis/status/1948148261585654023
https://x.com/great_martis/status/1967713280908197911
https://x.com/great_martis/status/1966274598124794327
https://markets.businessinsider.com/news/stocks/stock-market-outlook-shiller-pe-ratio-dot-com-bubble-ai-2025-9
https://en.wikipedia.org/wiki/Cyclically_adjusted_price-to-earnings_ratio
https://markets.businessinsider.com/news/stocks/stock-market-outlook-shiller-pe-ratio-dot-com-bubble-ai-2025-9?op=1
https://www.bogleheads.org/forum/viewtopic.php?t=440314
https://www.multpl.com/shiller-pe
https://www.man.com/insights/a-brief-history-of-bubbles
https://www.cnbc.com/2015/09/15/robert-shiller-this-is-the-sign-were-in-a-bubble.html
https://www.forbes.com/sites/greatspeculations/2025/10/16/sp-500-poised-for-a-40-crash/
https://news-pravda.com/usa/2025/10/05/1748218.html
https://www.aol.com/articles/shiller-p-e-ratio-trusted-144325362.html
https://www.benzinga.com/analyst-stock-ratings/analyst-color/25/10/48025536/shiller-pe-ratio-2025-ai-boom-not-a-bubble
https://totalwealthresearch.com/shiller-pe-warning-everything-rally-december-2025/
https://www.threads.com/@dividendology_yt/post/DNgJNABxnd7/the-shiller-pe-ratio-is-back-near-historic-highs1929-crash-30dot-com-bubble-44to
https://www.morningstar.com/news/marketwatch/20251011182/why-your-sp-500-index-fund-might-be-more-risky-than-the-internet-bubble
https://x.com/great_martis/status/1964456724708151358
https://x.com/great_martis/status/1948858982644547954
https://x.com/great_martis/status/1948148261585654023
https://x.com/great_martis/status/1949925668126675083
https://x.com/great_martis/status/1966274598124794327
https://x.com/great_martis/status/1968730504376533488
Want to see @great_martis's track record?
View their credibility score and all analyzed statements