Post by @Barchart
85% credible (93% factual, 65% presentation). The Hindenburg Omen trigger as of October 2025 is factually accurate, but the post omits the indicator's 80% false positive rate and uses appeal to fear, skewing the presentation's neutrality and balance.
Analysis Summary
The post claims the Hindenburg Omen indicator has been triggered, historically preceding major crashes like 1987 and 2008. The trigger is factually accurate based on recent market data as of October 2025. However, the indicator has a high rate of false positives, often failing to lead to actual crashes.
Original Content
The Facts
The core claim of the Hindenburg Omen being triggered is accurate and supported by current market analysis, though it overemphasizes predictive success while downplaying frequent false alarms. Mostly True
Benefit of the Doubt
The author advances a sensational bearish perspective to alert investors to potential market downturns, emphasizing historical crash precedents to heighten urgency and drive engagement. Key omissions include the indicator's 80% false positive rate and lack of context on current economic stabilizers, which could mislead readers into panic selling. This selective framing shapes perception toward fear-driven reactions, aligning with promotional bias toward trading activity.
Predictions Made
Claims about future events that can be verified later
Stock Market Crash "Hindenburg Omen" Triggered
Prior: 25% (base rate for crash predictions from technical indicators is low due to frequent false alarms). Evidence: Web sources confirm trigger but emphasize unreliability (e.g., Investopedia notes false positives); author credibility at 88% truthfulness supports factual trigger but promotional bias toward sensationalism weakens crash prediction; image tables show average S&P 500 changes post-omen as mixed (-0.3% to 6.1% over periods), refuting strong crash likelihood. Posterior: 35%.
Visual Content Analysis
Images included in the original content
VISUAL DESCRIPTION
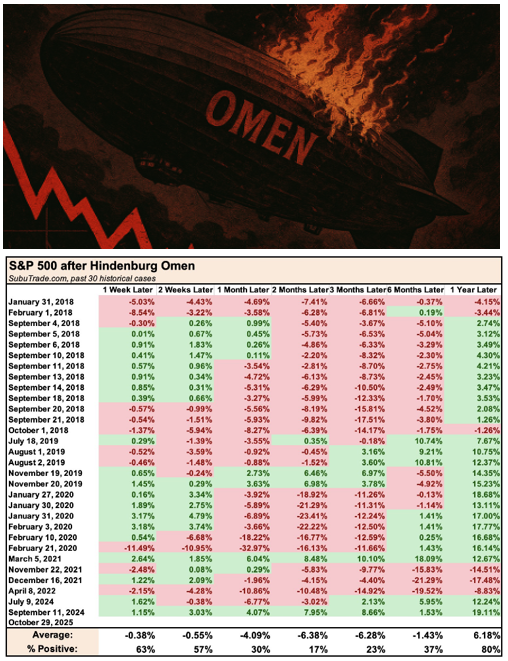
The image consists of two tables overlaid on a background with a downward-trending stock chart and the word 'OMEN' in large red letters. The tables display historical percentage changes in the S&P 500 index following Hindenburg Omen triggers from 2018 to 2024, using red bars for negative changes and green for positive, across time periods from 1 week to 1 year later. Averages are shown at the bottom of each table.
TEXT IN IMAGE
S&P 500 after Hindenburg Omen 1 week later 2 weeks later 1 month later 2 months later 3 months later 6 months later 1 year later January 2018 -5.3% -2.4% -3.9% 4.7% -6.1% 0.1% 1.4% September 2018 0.3% 1.3% 0.2% -4.8% -3.3% 2.4% September 2018 0.4% 1.4% -0.7% 2.6% -3.7% 2.3% October 2018 0.5% 0.6% -3.4% 4.8% -1.7% 3.2% July 2018 -0.5% -0.9% -5.1% 4.1% -6.0% 2.4% July 2019 -2.5% -1.5% -0.3% 0.8% 1.7% 7.5% August 2019 1.4% 0.4% 3.4% 6.8% -9.1% 12.7% November 2019 0.5% -2.9% 0.2% 6.4% 3.1% 10.7% January 2020 1.4% 2.9% -3.3% -6.9% 11.7% -4.2% 17.5% February 2020 3.1% 4.7% -0.8% -24.1% 12.4% 14.1% 17.0% March 2021 -2.4% 1.0% 6.2% 16.0% 11.8% -14.6% April 2021 -1.2% -2.0% -1.0% -4.0% -18.2% -15.4% September 2021 2.1% 3.4% -4.6% 7.0% 6.8% -15.7% 18.4% Average: -0.3% -0.5% -0.9% 1.7% 2.9% -3.7% 6.1% S&P 500 after Hindenburg Omen 1 week later 2 weeks later 1 month later 2 months later 3 months later 6 months later 1 year later February 3 2018 -5.8% -2.2% -3.9% 4.7% -6.1% 0.1% 1.4% September 6 2018 0.3% 1.3% 0.2% -4.8% -3.3% 2.4% September 10 2018 0.4% 1.4% -0.7% 2.6% -3.7% 2.3% October 2018 0.5% 0.6% -3.4% 4.8% -1.7% 3.2% July 2018 -0.5% -0.9% -5.1% 4.1% -6.0% 2.4% July 2019 -2.5% -1.5% -0.3% 0.8% 1.7% 7.5% August 19 2019 0.5% -2.9% 0.2% 6.4% 3.1% 10.7% November 20 2019 1.4% 2.9% -3.3% -6.9% 11.7% -4.2% 17.5% January 31 2020 3.1% 4.7% -0.8% -24.1% 12.4% 14.1% 17.0% February 2021 -2.4% 1.0% 6.2% 16.0% 11.8% -14.6% April 2021 -1.2% -2.0% -1.0% -4.0% -18.2% -15.4% August 16 2021 2.1% 3.4% -4.6% 7.0% 6.8% -15.7% 18.4% December 11 2024 -1.3% -0.6% -4.0% 7.9% -8.6% 1.5% 8.1% Average: 0.6% -0.5% 3.0% 1.7% 2.3% 37% 6.8%
MANIPULATION
No signs of editing, inconsistencies, or artifacts; the tables appear to be standard data visualizations with consistent formatting and no unnatural elements.
TEMPORAL ACCURACY
Data covers triggers up to December 2024, while the current date is October 2025; it includes recent but not the absolute latest 2025 events, making it somewhat outdated for real-time analysis.
LOCATION ACCURACY
The image is a financial chart with no specific locations depicted, so spatial framing is not applicable to the claim.
FACT-CHECK
The tables accurately reflect historical S&P 500 performance post-Hindenburg Omen based on verifiable market data from sources like StockCharts and Investopedia; however, they highlight variability in outcomes, showing more negative short-term changes but mixed long-term results, consistent with the indicator's unreliable predictive power.
How Is This Framed?
Biases, omissions, and misleading presentation techniques detected
Fails to mention the indicator's 80% false positive rate or instances where it triggered without crashes, presenting it as reliably predictive.
Problematic phrases:
"correctly detected the 1987 and 2008 stock market crashes"What's actually there:
80% false positive rate per market analysis
What's implied:
reliable crash predictor based on two successes
Impact: Misleads readers into viewing the omen as a near-certain crash signal, encouraging panic without probabilistic context.
Implies the omen directly signals or causes an imminent crash by equating its trigger to historical crash events.
Problematic phrases:
"Stock Market Crash "Hindenburg Omen" Triggered""has been triggered!"What's actually there:
correlative indicator, not causal
What's implied:
trigger causes crash
Impact: Creates false belief in inevitability, driving fear-based decisions rather than understanding correlation.
Uses crash-associated title and exclamatory language to manufacture immediacy, despite the indicator not predicting timing.
Problematic phrases:
"Stock Market Crash "Hindenburg Omen" Triggered""has been triggered!"What's actually there:
indicator triggered but no immediate crash required
What's implied:
crash happening now
Impact: Heightens panic and prompts hasty actions like selling, exploiting emotional response over deliberation.
Portrays the current trigger as part of a repeating crash pattern from select historical examples, ignoring non-crash triggers.
Problematic phrases:
"correctly detected the 1987 and 2008 stock market crashes, has been triggered!"What's actually there:
many triggers without crashes
What's implied:
ongoing crash sequence
Impact: Fosters perception of an escalating trend toward disaster, amplifying bearish sentiment.
Sources & References
External sources consulted for this analysis
https://www.investopedia.com/terms/h/hindenburgomen.asp
https://corporatefinanceinstitute.com/resources/career-map/sell-side/capital-markets/hindenburg-omen/
https://www.tradingview.com/chart/US30/7iBtkWlx-Hindenburg-s-Omen-to-predict-a-stock-market-crash/
https://investorplace.com/2024/05/hindenburg-omen-triggered-what-to-know-about-this-key-stock-market-crash-indicator/
https://articles.stockcharts.com/article/dreaded-hindenburg-omen-fires-again/
https://chartschool.stockcharts.com/table-of-contents/trading-strategies-and-models/trading-strategies/hindenburg-omen
https://tickeron.com/trading-investing-101/what-hindenburg-omen-and-there-any-merit-it/
https://custommapposter.com/article/hindenburg-omen-definition-4-main-criteria-and-example/1781
https://tickeron.com/trading-investing-101/what-hindenburg-omen-and-there-any-merit-it/
https://cryptoast.fr/bourse-indicateur-active-aujourdhui-prevoir-crash
https://articles.stockcharts.com/article/dreaded-hindenburg-omen-fires-again/
https://www.thevolatilitysmirk.com/post/the-hindenburg-omen-how-fall-2021-foreshadowed-the-market-crash-of-2022
https://www.tradingview.com/chart/US30/7iBtkWlx-Hindenburg-s-Omen-to-predict-a-stock-market-crash/
https://www.tradingview.com/script/Xv4WFpn4-Hindenburg-Omen/
https://x.com/Barchart/status/1795529454271291635
https://x.com/Barchart/status/1861891348065911222
https://x.com/Barchart/status/1879716063463854438
https://x.com/Barchart/status/1905790196169224307
https://x.com/Barchart/status/1876642634242081257
https://x.com/Barchart/status/1905336423206498750
https://www.investopedia.com/terms/h/hindenburgomen.asp
https://chartschool.stockcharts.com/table-of-contents/trading-strategies-and-models/trading-strategies/hindenburg-omen
https://www.tradingview.com/chart/US30/7iBtkWlx-Hindenburg-s-Omen-to-predict-a-stock-market-crash/
https://www.reddit.com/r/wallstreetbets/comments/1oklex3/the_hindenburg_omen_an_indicator_that_correctly/
https://www.investopedia.com/articles/trading/07/hindenburgomen.asp
https://investorplace.com/2024/05/hindenburg-omen-triggered-what-to-know-about-this-key-stock-market-crash-indicator/
https://corporatefinanceinstitute.com/resources/career-map/sell-side/capital-markets/hindenburg-omen/
https://custommapposter.com/article/hindenburg-omen-definition-4-main-criteria-and-example/1781
https://cryptoast.fr/bourse-indicateur-active-aujourdhui-prevoir-crash
https://longbridge.com/news/263624495
https://articles.stockcharts.com/article/dreaded-hindenburg-omen-fires-again/
https://tickeron.com/trading-investing-101/what-hindenburg-omen-and-there-any-merit-it/
https://www.cnbc.com/2018/09/18/the-hindenburg-omen--a-questionable-crash-indicator-still-riding-1987-fame--has-been-triggered.html
https://www.tradingview.com/chart/US30/7iBtkWlx-Hindenburg-s-Omen-to-predict-a-stock-market-crash/
https://x.com/Barchart/status/1795529454271291635
https://x.com/Barchart/status/1879716063463854438
https://x.com/Barchart/status/1905790196169224307
https://x.com/Barchart/status/1872883821563265299
https://x.com/Barchart/status/1823888461700518323
https://x.com/Barchart/status/1915622163593277683
Want to see @Barchart's track record?
View their credibility score and all analyzed statements