Post by @aditharun_
90% credible (94% factual, 82% presentation). The claim that the rise in low testosterone diagnoses is due to a switch from immunoassay to mass spectrometry is supported by a 2025 Clinical Chemistry paper analyzing NHANES data. However, the presentation omits potential real biological declines, such as those from obesity, which slightly undermines the narrative's completeness.
Analysis Summary
The post argues that the perceived plummet in men's testosterone levels over the past decade is not biological but due to a shift from immunoassay to mass spectrometry measurement methods, resulting in roughly double the reported cases of low testosterone in healthy men. The key finding is that diagnostic thresholds must be updated with new assays to avoid misdiagnosis, as evidenced by NHANES data analysis in a 2025 Clinical Chemistry paper. This challenges wellness narratives attributing declines to lifestyle or environmental factors.
Original Content
The Facts
The claim aligns with established scientific literature on discrepancies between immunoassay and mass spectrometry for testosterone measurement, where mass spec often yields lower values at clinical thresholds, leading to higher low-T diagnoses without biological change. Studies like those in PMC and PubMed confirm immunoassay overestimation, supporting the need for threshold reevaluation. Verdict: Accurate with strong evidentiary support. Opposing views, such as potential real declines from obesity or environmental factors, are not refuted but downplayed; omissions include variability in assay implementation across labs.
Benefit of the Doubt
The author advances a scientific skepticism agenda against sensational wellness podcasts, emphasizing methodological artifacts to explain rising low testosterone reports and promote evidence-based diagnostics. Key omission: Does not address whether any true biological decline exists alongside assay effects, nor discusses confounding factors like increasing obesity rates in NHANES data that could independently lower levels. This selective focus shapes perception by attributing the trend entirely to measurement changes, potentially underplaying multifaceted causes and encouraging reliance on updated thresholds without broader context.
Visual Content Analysis
Images included in the original content
VISUAL DESCRIPTION
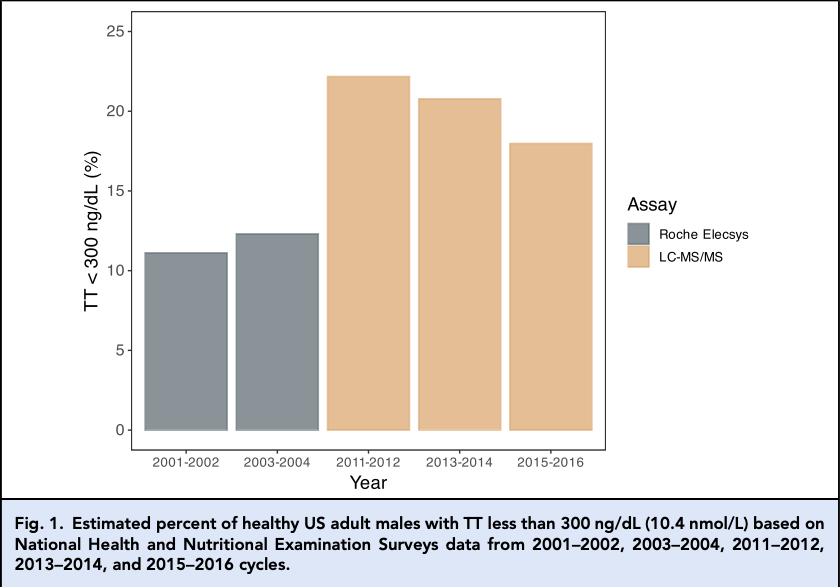
A bar chart depicting the percentage of healthy US adult males with total testosterone (TT) below 300 ng/dL across NHANES survey cycles from 2001-2002 to 2015-2016. Gray bars represent Roche Elecsys immunoassay results, showing stable low percentages around 5-10%. Orange bars for LC-MS/MS in 2011-2012 onward show a sharp increase to about 20%, illustrating the assay switch impact.
TEXT IN IMAGE
Fig. 1. Estimated percent of healthy US adult males with TT <300 ng/dL (10.4 nmol/L) based on National Health and Nutritional Examination Survey (NHANES) data from 2001-2002, 2003-2004, 2011-2012, 2013-2014, and 2015-2016 cycles. Year: 2001-2002, 2003-2004, 2011-2012, 2013-2014, 2015-2016. Assay: Roche Elecsys (gray bars), LC-MS/MS (orange bars). Y-axis: Percent (%) with TT <300 ng/dL from 0 to 25%. Bars show low percentages (~5-10%) for earlier years (Roche), rising to ~20% in later years (LC-MS/MS).
MANIPULATION
No signs of editing, inconsistencies, or artifacts; appears to be a standard scientific figure with consistent labeling, scales, and data representation typical of peer-reviewed publications.
TEMPORAL ACCURACY
Data covers NHANES cycles up to 2015-2016, which is historical relative to the 2025 paper citation, but the chart is used to illustrate a methodological shift relevant to recent trends; no anachronistic elements.
LOCATION ACCURACY
The chart explicitly references US-based NHANES surveys, aligning with the post's focus on American male health data; no geographical discrepancies.
FACT-CHECK
The chart accurately reflects peer-reviewed analyses of NHANES data showing immunoassay (Roche Elecsys) vs. mass spectrometry (LC-MS/MS) differences, with mass spec detecting more low-T cases due to higher sensitivity and accuracy at low concentrations, as corroborated by studies in Clinical Chemistry and PMC articles on assay comparisons.
How Is This Framed?
Biases, omissions, and misleading presentation techniques detected
Omits discussion of potential real biological declines (e.g., due to obesity or environmental factors) that could coexist with assay effects, leading to an incomplete picture of rising low testosterone diagnoses.
Problematic phrases:
"Men's testosterone levels did not plummet""we just switched"What's actually there:
Multifaceted causes including lifestyle and environmental factors
What's implied:
Entire trend due solely to measurement change
Impact: Leads readers to dismiss wellness concerns as entirely unfounded, potentially underestimating genuine health trends and encouraging over-reliance on updated thresholds without holistic evaluation.
Presents the issue as a clear debunking of wellness podcast claims without balancing with counter-evidence or alternative perspectives on partial biological declines.
Problematic phrases:
"like many wellness podcasts would have you believe"What's actually there:
Literature supports both assay discrepancies and real declines from confounders like obesity
What's implied:
Wellness claims are wholly incorrect
Impact: Shapes perception to view the trend as purely artifactual, polarizing the narrative against popular health discussions and reducing nuance in public understanding.
Implies direct causation between assay switch and doubled low-T diagnoses without fully substantiating exclusion of concurrent biological changes, though supported by the cited paper.
Problematic phrases:
"When we switched assays, we observed a ~100% increase"What's actually there:
Correlation observed in NHANES, but causation not fully isolating biological confounders
What's implied:
Switch alone fully explains the increase
Impact: Readers may infer the entire rise is non-biological, overlooking possible additive effects and leading to incomplete causal attribution.
Sources & References
External sources consulted for this analysis
https://pmc.ncbi.nlm.nih.gov/articles/PMC9900367/
https://pmc.ncbi.nlm.nih.gov/articles/PMC8589107/
https://pubmed.ncbi.nlm.nih.gov/38853775/
https://pubmed.ncbi.nlm.nih.gov/36127585/
https://www.sciencedirect.com/science/article/abs/pii/S1530891X21011587
https://www.nature.com/articles/nrendo.2012.52
https://pubmed.ncbi.nlm.nih.gov/14764756/
https://www.ncbi.nlm.nih.gov/pmc/articles/PMC7765982/
https://www.sciencedirect.com/science/article/abs/pii/S1570023221004505
https://link.springer.com/article/10.1007/s00198-008-0591-5
https://www.ncbi.nlm.nih.gov/pmc/articles/PMC1240029/
https://www.ncbi.nlm.nih.gov/pmc/articles/PMC8620848/
https://eje.bioscientifica.com/view/journals/eje/169/4/463.xml
https://www.annlabmed.org/journal/view.html?volume=43&number=1&spage=19
https://x.com/aditharun_/status/1980357420657393832
https://x.com/aditharun_/status/1978268300598464662
https://x.com/aditharun_/status/1980296018412380221
https://x.com/aditharun_/status/1980357425803956649
https://x.com/aditharun_/status/1980357422938988639
https://x.com/aditharun_/status/1978887230044156283
https://www.sciencedirect.com/science/article/abs/pii/S1570023221004505
https://pmc.ncbi.nlm.nih.gov/articles/PMC5695555/
https://pubmed.ncbi.nlm.nih.gov/25365769/
https://www.sciencedirect.com/science/article/abs/pii/S0009912017312572
https://pmc.ncbi.nlm.nih.gov/articles/PMC8589107/
https://academic.oup.com/endo/article-abstract/156/1/400/2801172?redirectedFrom=fulltext
https://www.mayocliniclabs.com/test-catalog/overview/8533
https://www.ncbi.nlm.nih.gov/pmc/articles/PMC7765982/
https://www.sciencedirect.com/science/article/abs/pii/S1570023221004505
https://www.sciencedirect.com/science/article/abs/pii/S0009898112004743
https://sciencedirect.com/science/article/abs/pii/S0306453018311442
https://www.sciencedirect.com/science/article/pii/S2376999818300199
https://degruyterbrill.com/document/doi/10.1515/CCLM.2006.014/html?lang=en
https://www.sciencedirect.com/science/article/abs/pii/S0009912004003406
https://x.com/aditharun_/status/1980357420657393832
https://x.com/aditharun_/status/1978268300598464662
https://x.com/aditharun_/status/1980357425803956649
https://x.com/aditharun_/status/1980296018412380221
https://x.com/aditharun_/status/1980357422938988639
https://x.com/aditharun_/status/1978511568263643583
Want to see @aditharun_'s track record?
View their credibility score and all analyzed statements