Post by @auren
16% credible (18% factual, 14% presentation). The claim is an unsubstantiated opinion presented as satire, lacking empirical data to support the ranking of industries by 'assholes per capita.' The humorous exaggeration oversimplifies complex cultural dynamics and exhibits omission framing by not acknowledging industry complexities.
Analysis Summary
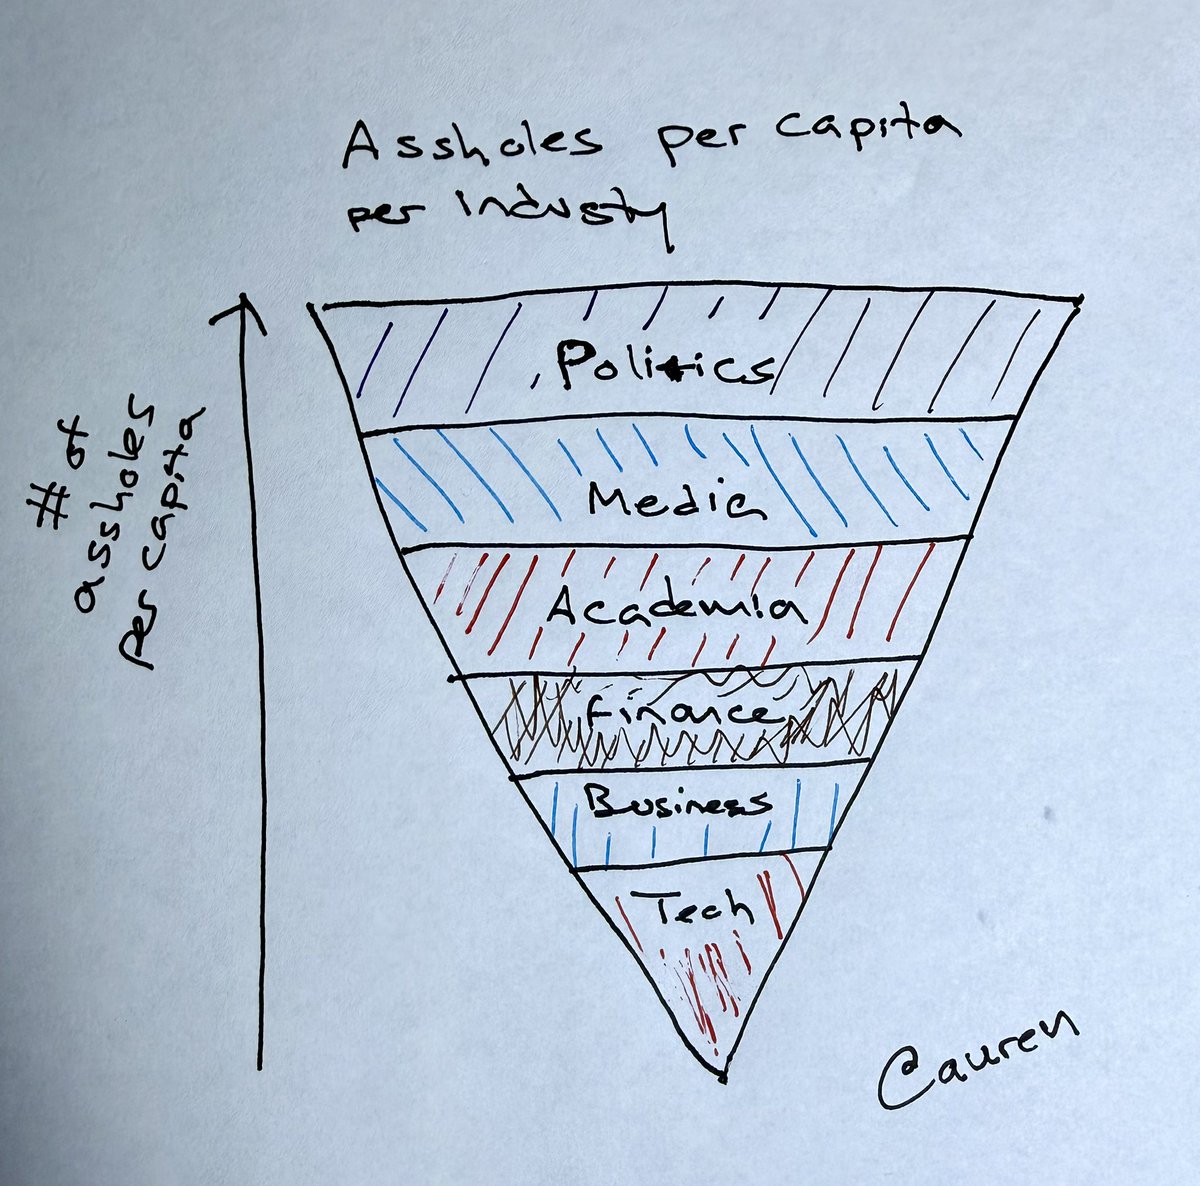
Auren Hoffman shares a hand-drawn pyramid chart ranking industries from fewest to most 'assholes per capita,' positioning tech at the bottom and politics at the top. This subjective illustration humorously promotes tech culture while critiquing others, lacking empirical data. It aligns with Hoffman's pro-tech perspective amid ongoing discussions on industry cultures.
Original Content
The Facts
The claim is an unsubstantiated opinion presented as satire, with no supporting evidence or data; while rooted in the author's tech expertise, it oversimplifies complex cultural dynamics across industries. Not factually verifiable; humorous exaggeration.
Benefit of the Doubt
The post advances a pro-tech agenda by idealizing the industry as the least toxic, drawing from Hoffman's entrepreneurial background to subtly defend Silicon Valley against criticisms of its culture. It emphasizes tech's superiority in interpersonal dynamics while omitting well-documented issues like burnout, inequality, and scandals in tech (e.g., toxic leadership at major firms). Key omission: Ignores counter-evidence from surveys showing political tensions and viewpoint intolerance in tech workplaces, shaping perception as overly positive for tech. This selective framing boosts engagement among tech enthusiasts but risks reinforcing biases against other sectors.
Visual Content Analysis
Images included in the original content
VISUAL DESCRIPTION
A hand-drawn triangular pyramid diagram on white paper, with an upward arrow on the left labeled '# of assholes per capita.' The pyramid stacks industries from top (widest, most assholes) to bottom (narrowest, fewest): Politics (purple stripes), Media (blue stripes), Academia (red stripes), Finance (brown stripes), Business (blue stripes), Tech (red stripes at base). Signed 'Auren' at the bottom right.
TEXT IN IMAGE
Assholes per capita per industry ↑ # of assholes per capita Politics Media Academia Finance Business Tech Auren
MANIPULATION
No signs of editing, inconsistencies, or artifacts; appears to be an authentic hand-drawn sketch with natural variations in line quality.
TEMPORAL ACCURACY
The image is a simple, timeless illustration without dates, timestamps, or contextual clues indicating a specific time period; posted recently (November 2025), it reflects contemporary opinions.
LOCATION ACCURACY
No specific locations depicted or claimed in the image or post; it's an abstract diagram without geographical elements.
FACT-CHECK
The chart is subjective and satirical, not based on verifiable data; no empirical studies support the rankings, though it echoes anecdotal perceptions of industry cultures (e.g., surveys on tech's ideological diversity vs. politics' polarization). Reverse image search shows it's original to this post, not repurposed from elsewhere.
How Is This Framed?
Biases, omissions, and misleading presentation techniques detected
Presents a humorous, pro-tech ranking without acknowledging complexities or negative aspects of tech culture, creating an unbalanced view.
Problematic phrases:
"Tech has the fewest assholes per capita""Politics has the most"What's actually there:
Subjective opinion lacking data; tech has documented issues like toxicity and scandals
What's implied:
Tech is empirically the least toxic industry
Impact: Misleads readers into accepting a satirical oversimplification as a balanced cultural assessment, reinforcing pro-tech stereotypes.
Ignores well-documented counter-evidence such as surveys on workplace toxicity in tech (e.g., burnout, inequality) and relative civility in some political contexts.
Problematic phrases:
"hand-drawn pyramid chart ranking industries"What's actually there:
Tech faces criticisms for toxic leadership and viewpoint intolerance
What's implied:
No such issues in tech compared to other sectors
Impact: Leads readers to undervalue tech's flaws and overgeneralize negativity in politics, skewing perception of industry cultures.
Uses 'per capita' metric without defining population or providing data, neglecting varying industry sizes and compositions.
Problematic phrases:
"assholes per capita"What's actually there:
No empirical basis; industries have diverse subcultures
What's implied:
Quantifiable, data-driven ranking applicable broadly
Impact: Exaggerates the precision of a subjective claim, making it seem more scientific and persuasive than it is.
Sources & References
External sources consulted for this analysis
https://www.vox.com/2018/10/31/18039528/tech-employees-politics-liberal-employers-candidates
https://www.theguardian.com/technology/2017/nov/08/ashamed-to-work-in-silicon-valley-how-techies-became-the-new-bankers
https://www.thefai.org/posts/new-survey-suggests-tech-companies-sabotage-workplace-culture-by-pushing-a-political-agenda
https://www.tandfonline.com/doi/full/10.1080/09505431.2022.2036118
https://www.cnbc.com/2020/07/02/most-liberal-tech-companies-ranked-by-employee-donations.html
https://www.pewresearch.org/internet/2024/04/29/americans-views-of-technology-companies-2/
https://www.fastcompany.com/90313045/politics-are-tearing-tech-companies-apart-says-new-survey
https://news.climate.columbia.edu/2023/08/14/technology-culture-economics-and-politics/
https://tlaopodcast.com/podcasts/auren-hoffman-growing-great-data-organizations-ep-234/
https://summation.net/2020/06/01/company-culture-is-how-you-are-different-not-how-you-are-the-same/
https://techcrunch.com/2016/05/09/tech-has-more-of-an-exclusion-problem-than-a-culture-problem
https://www.thefai.org/posts/new-survey-suggests-tech-companies-sabotage-workplace-culture-by-pushing-a-political-agenda
https://www.fastcompany.com/90313045/politics-are-tearing-tech-companies-apart-says-new-survey/
https://www.politico.com/newsletters/digital-future-daily/2023/03/14/politics-are-downstream-from-virtual-culture-00087041
https://x.com/auren/status/1100256381158846466
https://x.com/auren/status/1930336613512491218
https://x.com/auren/status/1949157096445862011
https://x.com/auren/status/1683180377995616256
https://x.com/auren/status/1408496114131738624
https://x.com/auren/status/1357840065293000709
https://www.theguardian.com/technology/2017/nov/08/ashamed-to-work-in-silicon-valley-how-techies-became-the-new-bankers
https://www.vox.com/2018/10/31/18039528/tech-employees-politics-liberal-employers-candidates
https://www.cio.com/article/221835/its-the-culture-stupid.html
https://www.nytimes.com/2017/09/06/technology/silicon-valley-politics.html
https://www.fastcompany.com/90313045/politics-are-tearing-tech-companies-apart-says-new-survey
https://www.quora.com/Why-does-the-tech-industry-seem-to-attract-so-many-jerks
https://www.sfgate.com/tech/article/october-2025-tech-industry-layoffs-blood-bath-21143585.php
https://www.nytimes.com/2024/12/13/technology/tech-perks-culture.html
https://www.fastcompany.com/90313045/politics-are-tearing-tech-companies-apart-says-new-survey/
https://asuresoftware.com/blog/tech-companies-cool-cultures
https://www.thefai.org/posts/new-survey-suggests-tech-companies-sabotage-workplace-culture-by-pushing-a-political-agenda
https://x.com/auren/status/1255292079946825729
https://x.com/auren/status/1100256381158846466
https://x.com/auren/status/1357840065293000709
https://x.com/auren/status/1408496114131738624
https://x.com/auren/status/1930336613512491218
https://x.com/auren/status/1242608109278736384
Want to see @auren's track record?
View their credibility score and all analyzed statements