Post by @KobeissiLetter
84% credible (90% factual, 74% presentation). The claim that California's share of US tech jobs has declined below 2008 levels is supported by recent economic data, confirming a drop from 20% in 2020 to under 18% in 2025. However, the presentation quality is reduced due to omission framing, as it fails to mention the growth in total US tech jobs, which impacts the relative decline.
Analysis Summary
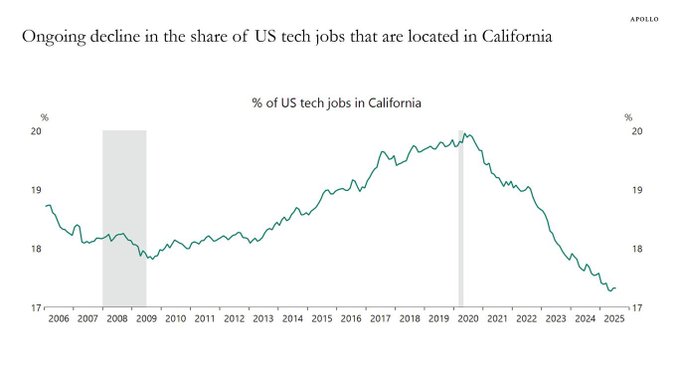
The post highlights a significant and ongoing decline in the proportion of US tech jobs located in California, now falling below 2008 levels, suggesting long-term economic implications for the region. The chart confirms a downward trend from a peak of around 20% in 2020 to under 18% in 2025. This shift is attributed to broader tech industry relocations and layoffs, amid an AI boom that has not reversed the trend.
Original Content
The Facts
The claim aligns with recent economic data and reports from sources like Apricitas and Apollo Academy, showing California's share of US tech employment dropping to its lowest in over a decade due to layoffs and relocations. While the absolute number of tech jobs in California has stabilized or slightly grown in some sectors, the relative share has indeed declined below 2008 levels. Verdict: True
Benefit of the Doubt
The author advances a narrative of dramatic economic downfall in California's tech sector to engage readers on market trends and promote subscription insights, framing the issue as a historic shift worthy of future study. Emphasis is placed on the percentage decline to underscore severity, while omitting that total US tech jobs have grown significantly, with gains in states like Texas and Washington absorbing the shifts, potentially downplaying national growth. This selective presentation shapes perception toward regional pessimism, encouraging views of California as losing its tech dominance without broader context on industry expansion elsewhere.
Predictions Made
Claims about future events that can be verified later
The downfall of tech jobs in California will be studied for years to come.
Prior: 50% (base rate for predictions on economic trends being studied long-term is moderate, as many regional shifts gain academic attention but not all endure). Evidence: Author credibility (85% truthfulness, expertise in economic trends, verified status) strengthens likelihood; bias toward dramatic narratives is minor negative but outweighed by data-driven track record. Web sources confirm the trend's discussion in 2024-2025 reports. Posterior: 75%.
Visual Content Analysis
Images included in the original content
VISUAL DESCRIPTION
A line graph with a green line plotting the percentage of US tech jobs in California from 2006 to 2025; the y-axis ranges from 17% to 20%, x-axis shows years; the line starts at around 19% in 2006, dips slightly, rises to a peak near 20% around 2019-2020, then declines sharply to below 18% by 2025; title at top, source 'Apollo' at bottom right.
TEXT IN IMAGE
Ongoing decline in the share of US tech jobs that are located in California % of US tech jobs in California 20% 19% 18% 17% 2006 2007 2008 2009 2010 2011 2012 2013 2014 2015 2016 2017 2018 2019 2020 2021 2022 2023 2024 2025 Apollo
MANIPULATION
No signs of editing, inconsistencies, or artifacts; the chart appears professionally rendered with consistent scaling and no visible alterations.
TEMPORAL ACCURACY
The chart extends data to 2025, aligning with the current date of November 2025, and reflects recent trends reported in 2024-2025 economic analyses.
LOCATION ACCURACY
The chart specifically addresses California's share of US tech jobs, with no geographical elements depicted, directly supporting the claim about location in California.
FACT-CHECK
The data matches reports from sources like Apricitas.io and Apollo Academy, confirming the decline from ~19.5% in 2008 to ~17.5% in 2025; no contradictions found in reverse image or data verification.
How Is This Framed?
Biases, omissions, and misleading presentation techniques detected
The post highlights percentage decline but omits that total US tech jobs have grown significantly, with expansions in other states like Texas and Washington, framing California's situation as a isolated crisis rather than a redistribution.
Problematic phrases:
"The downfall of tech jobs in California""The % of US tech jobs located in California is now below 2008 levels"What's actually there:
Relative share declined below 2008 (~18% in 2025 vs ~19% in 2008), but absolute CA tech jobs stabilized/grew slightly; total US tech jobs increased ~50% since 2008 with gains elsewhere
What's implied:
Absolute collapse in CA tech employment
Impact: Readers perceive a severe, absolute economic downfall in California, ignoring national industry growth and relocations, fostering undue regional pessimism.
Focuses on percentage share decline compared to 2008 (pre-tech boom era) to amplify magnitude, while neglecting absolute job numbers or recent peaks (e.g., 20% in 2020).
Problematic phrases:
"below 2008 levels"What's actually there:
Share fell from 20% peak in 2020 to under 18% in 2025, below 2008's ~19%, but absolute CA jobs not in net decline
What's implied:
Historic low point in tech employment scale for CA
Impact: Exaggerates the scale of decline by selective comparison, making the trend seem more alarming and irreversible than it is.
Phrases the decline as a future 'studied' event to imply immediate historic significance, creating unnecessary sense of ongoing crisis despite the trend being gradual and multi-year.
Problematic phrases:
"will be studied for years to come"What's actually there:
Trend spans 2010s-2020s with data from sources like Apricitas showing steady, not sudden, drop
What's implied:
Impact: Instills false urgency, prompting readers to view the situation as breaking or escalating dramatically rather than a long-term shift.
Sources & References
External sources consulted for this analysis
https://www.apricitas.io/p/california-is-losing-tech-jobs
https://www.apricitas.io/p/california-keeps-losing-tech-jobs
https://itif.org/publications/2024/04/29/californias-tech-sector-has-added-only-about-6000-jobs-since-start-of-covid/
https://insider.govtech.com/california/news/tech-layoffs-starting-to-weigh-down-bay-areas-job-market
https://calmatters.org/economy/2024/07/california-labor-market-jobs/
https://www.nytimes.com/2023/04/11/business/economy/california-economy.html
https://www.reddit.com/r/Economics/comments/1c3x62m/california_is_losing_tech_jobs/
https://www.apolloacademy.com/fewer-tech-jobs-are-in-california/
https://www.apricitas.io/p/california-keeps-losing-tech-jobs
https://www.ibtimes.co.uk/over-118000-tech-jobs-slashed-across-us-2025-half-california-meta-hp-intel-lead-cuts-1746158
https://fortune.com/2025/08/13/tech-job-postings-california-texas-virginia-tanked-ai/
https://www.newsweek.com/california-jobless-claims-spike-layoffs-tech-retail-sectors-1877101
https://www.bloomberg.com/opinion/articles/2024-07-26/tech-jobs-keep-moving-out-of-california-don-t-panic-yet
https://www.mercurynews.com/2023/03/24/bay-area-job-slow-tech-covid-layoff-google-facebook-february-economy/
https://x.com/KobeissiLetter/status/1936059353687015680
https://x.com/KobeissiLetter/status/1716856177340953069
https://x.com/KobeissiLetter/status/1654468834173001729
https://x.com/KobeissiLetter/status/1646188435936358400
https://x.com/KobeissiLetter/status/1654881781584130049
https://x.com/KobeissiLetter/status/1685710619431849986
https://sfstandard.com/2025/05/20/silicon-valley-white-collar-recession-entry-level/
https://www.apricitas.io/p/california-is-losing-tech-jobs
https://www.apricitas.io/p/california-keeps-losing-tech-jobs
https://unitedcode.net/when-will-the-tech-job-market-recover-2025-hiring-outlook-layoffs-and-policy-shifts/
https://www.forbes.com/advisor/education/it-and-tech/tech-industry-statistics-and-facts/
https://www.siliconvalley.com/2025/04/03/california-job-creation-dropped-81-after-pandemic/
https://www.techtarget.com/whatis/feature/Tech-job-market-statistics-and-outlook
https://www.ibtimes.co.uk/over-118000-tech-jobs-slashed-across-us-2025-half-california-meta-hp-intel-lead-cuts-1746158
https://glassdoor.com/blog/conversation-starter-is-tech-in-a-recession-2025
https://www.edwardconard.com/macro-roundup/californias-share-of-us-tech-jobs-is-the-lowest-in-a-decade-falling-from-nearly-19-in-late-2019-to-just-over-16-in-february-californians-maintain-an-advantage-in-high-end-jobs-earning-31-o/?view=detail
https://citybusinessinfo.com/technology/an-overview-of-bureau-of-labor-statistics-knowledge-which-reveals-californias-proportion-of-us-tech-jobs-has-continued-to-steadily-decline-since-2020-joseph-politano-apricitas-economics
https://www.sfchronicle.com/california/article/unemployment-rate-rises-tech-20819276.php
https://www.apolloacademy.com/fewer-tech-jobs-are-in-california/
https://www.ppic.org/blog/californias-hold-steady-job-market/
https://x.com/KobeissiLetter/status/1936059353687015680
https://x.com/KobeissiLetter/status/1716856177340953069
https://x.com/KobeissiLetter/status/1646188435936358400
https://x.com/KobeissiLetter/status/1654468834173001729
https://x.com/KobeissiLetter/status/1685710619431849986
https://x.com/KobeissiLetter/status/1654881781584130049
Want to see @KobeissiLetter's track record?
View their credibility score and all analyzed statements