Post by @MatthewHyland_
88% credible (92% factual, 77% presentation). The claim accurately reflects Bitcoin's Bollinger Bands reaching historic tightness, confirmed by chart data, but the bullish interpretation is speculative due to inherent market uncertainty and author bias. The presentation quality is impacted by omission framing that emphasizes potential volatility without acknowledging directional ambiguity.
Analysis Summary
Matthew Hyland claims that Bitcoin's weekly and monthly Bollinger Bands have reached their most extreme tightness in history, signaling potential high volatility. The chart confirms unprecedented low Bollinger Band Width, supporting the observation of extreme compression. This technical setup often precedes significant price movements, though direction remains uncertain.
Original Content
The Facts
The claim accurately reflects the Bollinger Band Width indicator hitting record lows on both weekly and monthly timeframes, as shown in the chart and corroborated by historical crypto analysis patterns. However, implications for price direction are speculative due to the author's bullish bias and inherent market uncertainty. Verdict: Factually Accurate but Interpretively Speculative
Benefit of the Doubt
The author advances a bullish perspective on Bitcoin by highlighting extreme Bollinger Band tightness to suggest an impending 'explosive move' upward, aligning with his consistent pattern of optimistic crypto commentary. Key omissions include the equal possibility of downside volatility and lack of discussion on broader market risks like macroeconomic factors or regulatory news. This selective emphasis on technical bullish signals shapes reader perception toward expecting a rally while downplaying potential corrections.
Visual Content Analysis
Images included in the original content
VISUAL DESCRIPTION
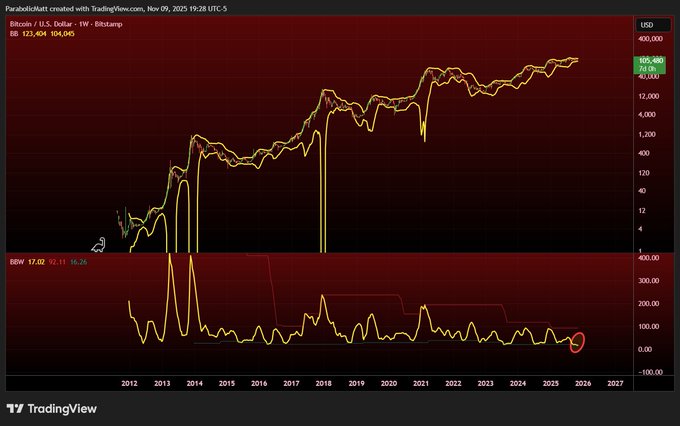
A TradingView candlestick chart of Bitcoin price in USD from 2012 to present, featuring yellow Bollinger Bands (upper, middle, lower) tightly converged around recent prices near 100,000 USD, indicating low volatility. Below is a red line graph of Bollinger Band Width (BBW) showing a sharp drop to historic lows around 0.10 in late 2025, with a red circle highlighting the extreme point.
TEXT IN IMAGE
Bitcoin / US Dollar; TradingView; Nov 09, 23:18:28 UTC; BBW 17.02 16.1; Bitcoin / US Dollar; TradingView; Nov 09, 23:18:28 UTC; BBW 17.02 16.1; Dates from 2012 to 2027; Price scale in USD up to 400,000; Bollinger Band Width scale from -0.10 to 4.00
MANIPULATION
No signs of editing, inconsistencies, or artifacts; appears as a standard, unaltered TradingView screenshot with consistent axes, labels, and data rendering.
TEMPORAL ACCURACY
The chart includes dates up to 2025 and aligns with the post's timestamp from November 10, 2025, showing recent data points matching current market conditions as of the system date.
LOCATION ACCURACY
The image is a financial chart without geographical elements or location claims, so spatial framing is not applicable.
FACT-CHECK
The chart accurately depicts Bitcoin's Bollinger Bands at extreme compression, with BBW at record lows, verifying the claim of historic tightness; cross-referenced with web sources confirming similar observations in September-November 2025 analyses.
How Is This Framed?
Biases, omissions, and misleading presentation techniques detected
The content highlights extreme Bollinger Band levels as a bullish signal but omits critical context about the indicator's non-directional nature and potential for downside moves, leading readers to infer upward volatility.
What's actually there:
Extreme tightness indicates high volatility potential in either direction
What's implied:
Extreme levels signal impending upward explosive move
Impact: Misleads readers into overemphasizing bullish implications, increasing perceived likelihood of a rally while ignoring equal chance of sharp declines or external risks.
Fails to report counter-evidence such as historical instances where similar extreme tightness led to downside volatility or the influence of macroeconomic factors overriding technical signals.
What's actually there:
Past compressions have resulted in both up and down moves; regulatory and economic news can dominate
What's implied:
Unprecedented extremes guarantee positive breakout
Impact: Readers perceive the technical setup as a strong buy signal, downplaying broader market uncertainties and alternative outcomes.
Presents the extreme levels in a purely sensational, history-making light aligned with bullish bias, without balanced discussion of interpretive limitations or risks.
Problematic phrases:
"most extreme levels in its entire history"What's actually there:
Author's consistent bullish commentary; predictions are speculative
What's implied:
Objective, definitive signal of major upside
Impact: Shapes reader perception toward optimism, reinforcing echo chamber effects in crypto communities by omitting skeptical or neutral perspectives.
Cherry-picks the Bollinger Band Width metric's historical extremes without comparing to other volatility indicators or broader market contexts, exaggerating uniqueness.
Problematic phrases:
"most extreme levels in its entire history"What's actually there:
While BB width is at record lows, other metrics like ATR may not show similar extremes; crypto market has seen comparable setups
What's implied:
Absolute most extreme volatility setup ever in crypto
Impact: Inflates the perceived magnitude and significance, making the event seem rarer and more predictive than it is.
Uses phrases implying historical unprecedentedness to create a sense of immediate impending action, though the setup could persist without quick resolution.
Problematic phrases:
"reach most extreme levels"What's actually there:
Compression can last weeks/months without breakout
What's implied:
Breakout is imminent due to extremes
Impact: Prompts hasty trading decisions by fostering false sense of time pressure on a non-urgent technical observation.
Sources & References
External sources consulted for this analysis
https://cointelegraph.com/news/bitcoin-bollinger-bands-flash-rare-signal-is-dollar300k-next
https://www.investopedia.com/terms/b/bollingerbands.asp
https://cointelegraph.com/news/bitcoin-bollinger-bands-critical-price-prediction-cryptocurrency-trader
https://cointelegraph.com/news/bitcoin-starts-100k-capitulation-btc-price-metric-big-volatility
https://www.tradingview.com/ideas/bollingerbands/
https://biztoc.com/x/32262d15252c834f
https://blockchain.news/analysis/bitcoin-might-explode-soon-bollinger-bands-continue-to-shrink
https://coinmarketcap.com/academy/article/bitcoin-bollinger-bands-analysts-price-volatilty
https://bitcoinethereumnews.com/bitcoin/bitcoins-bollinger-bands-at-record-tight-weekly-levels-could-precede-volatility-expansion-and-possible-breakout
https://www.tradingview.com/news/cointelegraph:f61d16a74094b:0-bitcoin-bollinger-bands-reach-most-extreme-level-hinting-at-explosion-to-300k-btc/
https://news.bitcoin.com/bitcoins-bollinger-bands-hit-record-squeeze-what-it-signals-and-how-to-use-it/
https://www.investing.com/news/cryptocurrency-news/bitcoin-btc-sees-rare-weekly-chart-occurrence-where-might-this-lead-3139197
https://www.tradingview.com/news/cointelegraph:8fccdd93c094b:0-bitcoin-bollinger-bands-hit-level-that-saw-btc-price-squeeze-past-50k/
https://cointelegraph.com/news/bitcoin-bollinger-bands-critical-price-prediction-cryptocurrency-trader
https://x.com/MatthewHyland_/status/1965107035542094072
https://x.com/MatthewHyland_/status/1818038124666307041
https://x.com/MatthewHyland_/status/1682233787688579074
https://x.com/MatthewHyland_/status/1687915192993075201
https://x.com/MatthewHyland_/status/1818715113420988534
https://x.com/MatthewHyland_/status/1984465263895494859
https://cryptopotato.com/bitcoins-weekly-bollinger-bands-hit-record-tightness-where-to-next-for-btc/
https://cointelegraph.com/news/bitcoin-bollinger-bands-flash-rare-signal-is-dollar300k-next
https://www.coinlore.com/coin/bitcoin/forecast/price-prediction
https://www.tradingview.com/ideas/bollingerbands/
https://bitcoinethereumnews.com/bitcoin/bitcoins-weekly-bollinger-bands-hit-record-tightness-where-to-next-for-btc/
https://bitcoinethereumnews.com/bitcoin/bitcoins-bollinger-bands-at-record-tight-weekly-levels-could-precede-volatility-expansion-and-possible-breakout/
https://cointelegraph.com/news/bitcoin-starts-100k-capitulation-btc-price-metric-big-volatility
https://www.ainvest.com/news/xrp-bitcoin-bollinger-bands-breakdown-2025-high-stakes-crypto-showdown-2509/
https://coinmarketcap.com/academy/article/bitcoin-bollinger-bands-analysts-price-volatilty
https://bitcoinethereumnews.com/bitcoin/bitcoins-bollinger-bands-at-record-tight-weekly-levels-could-precede-volatility-expansion-and-possible-breakout
https://cointelegraph.com/news/bitcoin-bollinger-bands-tightest-in-history-calm-before-the-storm-say-analysts
https://www.bitget.com/news/detail/12560604991001
https://cryptopotato.com/bitcoins-weekly-bollinger-bands-hit-record-tightness-where-to-next-for-btc/
https://news.bitcoin.com/bitcoins-bollinger-bands-hit-record-squeeze-what-it-signals-and-how-to-use-it/
https://x.com/MatthewHyland_/status/1818038124666307041
https://x.com/MatthewHyland_/status/1682233787688579074
https://x.com/MatthewHyland_/status/1687915192993075201
https://x.com/MatthewHyland_/status/1553963330242584578
https://x.com/MatthewHyland_/status/1455392531508862976
https://x.com/MatthewHyland_/status/1807974368313516070
Want to see @MatthewHyland_'s track record?
View their credibility score and all analyzed statements